Dashboards for the New York Times
As a data visualization engineer for the New York Times, I worked with a team of 4-6 to develop an interactive visual dashboard for business intelligence analytics. By the time I left, we had built over 100 up-to-date charts for 18 teams throughout the company. The screenshots below are for demonstration only and contain no real data. For more information on the motivation and process, refer to my April 2015 talk at the Data Visualization Summit, in San Jose.
Overall Look

A screenshot of what a typical page might look like. Each team got its own page, with a few charts on it. Each chart had several navigation options.
Revenue

A screenshot of a revenue page and table. The table provided users an immediate answer to their most common question: "Is there anything I need to be worried about right now?"
Revenue: Closer look
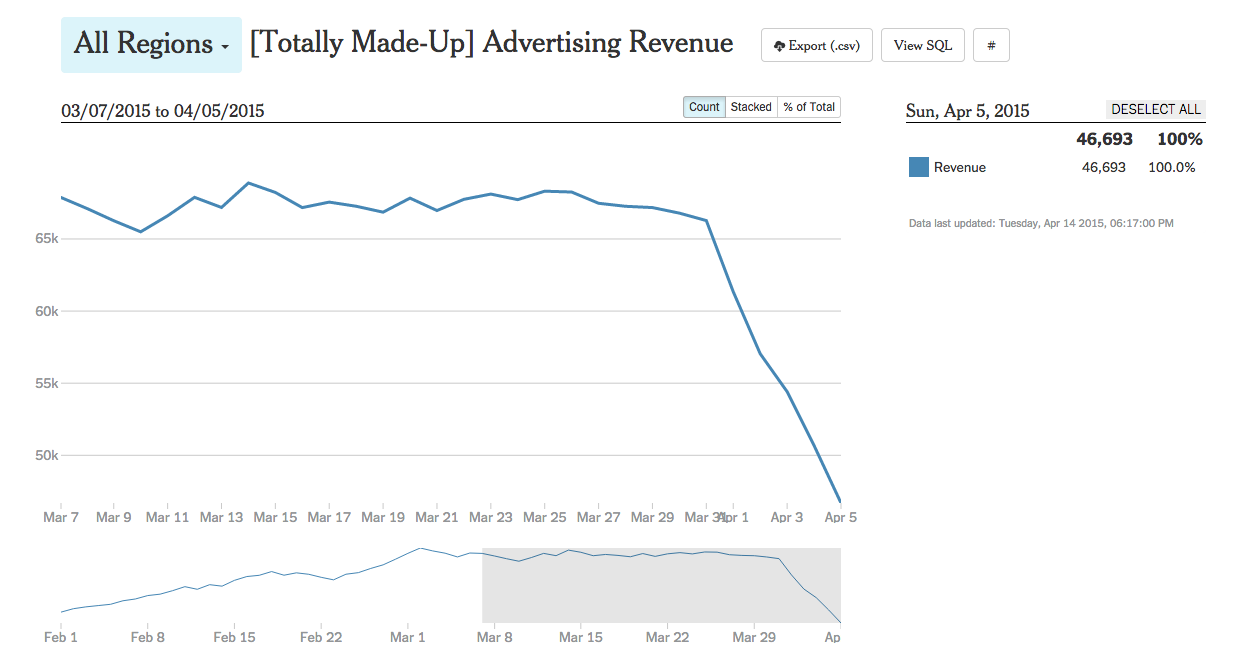
A closer look at the revenue line chart.
Impressions by Campaign

A screenshot of a chart that breaks down the number of impressions for each ad running ad campaign.